High-Protein Eating Out, by Cuisine
Every cuisine has the same pattern: two or three dishes that are genuinely Platinum or Gold tier, and a row of familiar orders that look like protein but are mostly rice, oil and sauce. Pick a cuisine to see exactly what to order — and what to treat as the carb.
98 dishes across 11 cuisines · ranked by Protein Density (% of calories from protein) · estimates reconstructed from USDA SR-Legacy ingredient data
Pick the cuisine, then pick inside it
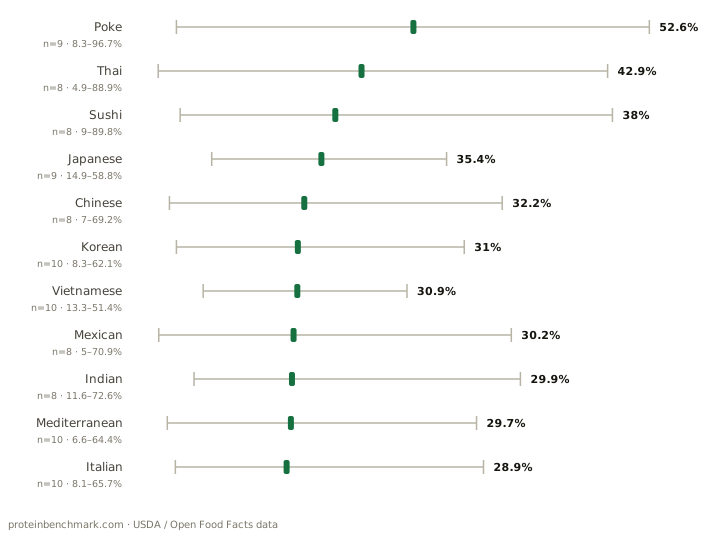
The bar is the range of protein density on the menu; the notch is the median dish. A wide bar means the cuisine is a coin-flip — the dish choice does the work.
FILLED BAR = MIN–MAX RANGE · NOTCH = MEDIAN DISH · DOT = BEST DISH
| Cuisine | Dishes | Median | Range | Best dish |
|---|---|---|---|---|
| Poke | 9 | 47.9% | 8.3–96.7% | Shrimp (cooked, plain) |
| Sushi | 8 | 38.5% | 9–89.8% | Tuna Sashimi (6 pieces) |
| Chinese | 8 | 34.1% | 7–69.2% | Steamed Chicken & Broccoli (sauce on side) |
| Thai | 8 | 33.4% | 4.9–88.9% | Tom Yum Soup with Shrimp |
| Vietnamese | 10 | 31.9% | 13.3–51.4% | Ga Nuong Sa (Grilled Lemongrass Chicken) |
| Japanese | 9 | 31.1% | 14.9–58.8% | Shabu-Shabu (beef & tofu hot pot, no rice) |
| Korean | 10 | 30.6% | 8.3–62.1% | Bulgogi (Grilled Marinated Beef) |
| Mediterranean | 10 | 23.0% | 6.6–64.4% | Chicken Souvlaki (Grilled Skewers) |
| Mexican | 8 | 21.9% | 5–70.9% | Carne Asada (plate, no tortillas) |
| Indian | 8 | 20.8% | 11.6–72.6% | Chicken Tikka (2 skewers) |
| Italian | 10 | 20.5% | 8.1–65.7% | Grilled Chicken Breast (Pollo alla Griglia) |
8 dishes · best pick: Tuna Sashimi (6 pieces) (89.8%) · 5 hit Gold or Platinum
8 dishes · best pick: Chicken Tikka (2 skewers) (72.6%) · 4 hit Gold or Platinum
8 dishes · best pick: Carne Asada (plate, no tortillas) (70.9%) · 4 hit Gold or Platinum
8 dishes · best pick: Steamed Chicken & Broccoli (sauce on side) (69.2%) · 5 hit Gold or Platinum
8 dishes · best pick: Tom Yum Soup with Shrimp (88.9%) · 4 hit Gold or Platinum
10 dishes · best pick: Grilled Chicken Breast (Pollo alla Griglia) (65.7%) · 4 hit Gold or Platinum
10 dishes · best pick: Bulgogi (Grilled Marinated Beef) (62.1%) · 5 hit Gold or Platinum
9 dishes · best pick: Shabu-Shabu (beef & tofu hot pot, no rice) (58.8%) · 7 hit Gold or Platinum
10 dishes · best pick: Ga Nuong Sa (Grilled Lemongrass Chicken) (51.4%) · 7 hit Gold or Platinum
10 dishes · best pick: Chicken Souvlaki (Grilled Skewers) (64.4%) · 4 hit Gold or Platinum
9 dishes · best pick: Shrimp (cooked, plain) (96.7%) · 8 hit Gold or Platinum
When appetite is suppressed, every restaurant meal has to earn its calories. The GLP-1 dining-out playbook, by cuisine.
A single dish, ranked across crusts instead of across cuisines — thin-crust chicken and a blended cottage-cheese crust lead.
Bowl builds pulled from across these cuisines plus poke-bar scoops, ranked on one table — poke and a no-tortilla fajita bowl lead; rice-heavy bowls trail.
How much protein do you actually need?
Knowing the densest dish only helps if you know your target. Run your numbers, then use these guides to hit it when you're eating out instead of cooking.