Highest protein beans and legumes, ranked
18 beans, lentils, peas and soy ranked by protein per 100 g cooked and by Protein Density — the share of each food's calories that comes from protein. Every figure is USDA SR-Legacy data at the same 100 g cooked serving, so no bean wins here just by being heavier per cup.
Protein per 100 calories
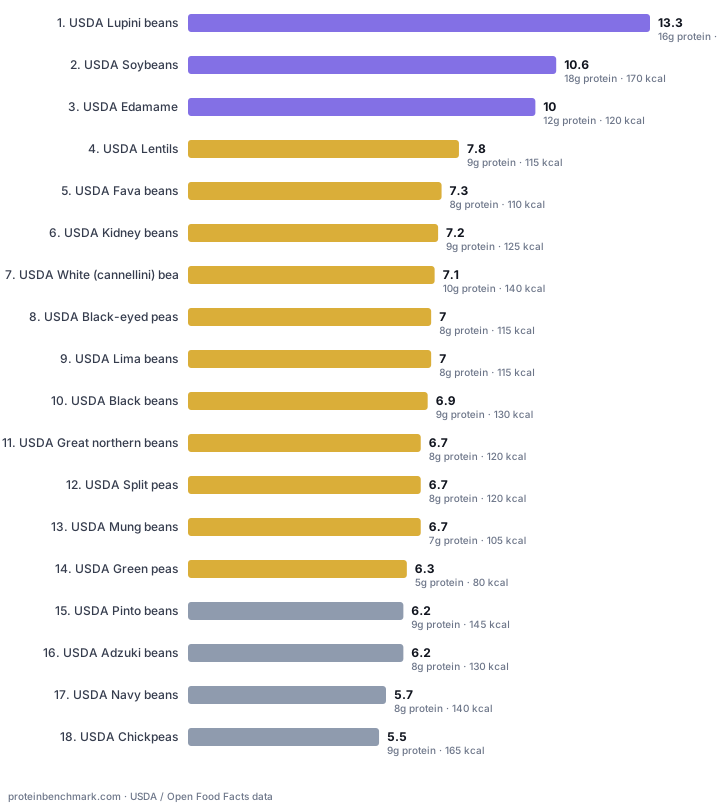
The same ranking in absolute terms — grams of protein you get per 100 calories spent. Protein Density is exactly four times this number, so the order never differs.
Top 18 by protein / 100 cal.
Bars colored by Protein Density (% of calories from protein) tier. Values in g/100cal.
- USDA Lupini beans: 13.3 g/100cal (platinum tier), 16g protein, 120 kcal
- USDA Soybeans: 10.6 g/100cal (platinum tier), 18g protein, 170 kcal
- USDA Edamame: 10 g/100cal (platinum tier), 12g protein, 120 kcal
- USDA Lentils: 7.8 g/100cal (gold tier), 9g protein, 115 kcal
- USDA Fava beans: 7.3 g/100cal (gold tier), 8g protein, 110 kcal
- USDA Kidney beans: 7.2 g/100cal (gold tier), 9g protein, 125 kcal
- USDA White (cannellini) beans: 7.1 g/100cal (gold tier), 10g protein, 140 kcal
- USDA Black-eyed peas: 7 g/100cal (gold tier), 8g protein, 115 kcal
- USDA Lima beans: 7 g/100cal (gold tier), 8g protein, 115 kcal
- USDA Black beans: 6.9 g/100cal (gold tier), 9g protein, 130 kcal
- USDA Great northern beans: 6.7 g/100cal (gold tier), 8g protein, 120 kcal
- USDA Split peas: 6.7 g/100cal (gold tier), 8g protein, 120 kcal
- USDA Mung beans: 6.7 g/100cal (gold tier), 7g protein, 105 kcal
- USDA Green peas: 6.3 g/100cal (gold tier), 5g protein, 80 kcal
- USDA Pinto beans: 6.2 g/100cal (silver tier), 9g protein, 145 kcal
- USDA Adzuki beans: 6.2 g/100cal (silver tier), 8g protein, 130 kcal
- USDA Navy beans: 5.7 g/100cal (silver tier), 8g protein, 140 kcal
- USDA Chickpeas: 5.5 g/100cal (silver tier), 9g protein, 165 kcal
Static image of this chart (for sharing)
Every bean and legume, ranked: protein per 100 g
Grams of protein and calories per 100 g cooked (about half a cup), the protein you get per 100 calories, and the Protein Density tier. Sorted by density; the protein column alone would order a few rows differently.
| Bean / legume | Protein / 100 g | Calories / 100 g | Protein / 100 cal | Density | Quality |
|---|---|---|---|---|---|
| Lupini beans 100 g cooked | 16g | 120 | 13.3g | 53.3% Platinum | Complete (mod.) |
| Soybeans 100 g cooked | 18g | 170 | 10.6g | 42.4% Platinum | Complete (mod.) |
| Edamame 100 g cooked | 12g | 120 | 10g | 40% Platinum | Complete (mod.) |
| Lentils 100 g cooked | 9g | 115 | 7.8g | 31.3% Gold | Complete (mod.) |
| Fava beans 100 g cooked | 8g | 110 | 7.3g | 29.1% Gold | Complete (mod.) |
| Kidney beans 100 g cooked | 9g | 125 | 7.2g | 28.8% Gold | Complete (mod.) |
| White (cannellini) beans 100 g cooked | 10g | 140 | 7.1g | 28.6% Gold | Complete (mod.) |
| Black-eyed peas 100 g cooked | 8g | 115 | 7g | 27.8% Gold | Complete (mod.) |
| Lima beans 100 g cooked | 8g | 115 | 7g | 27.8% Gold | Complete (mod.) |
| Black beans 100 g cooked | 9g | 130 | 6.9g | 27.7% Gold | Complete (mod.) |
| Great northern beans 100 g cooked | 8g | 120 | 6.7g | 26.7% Gold | Complete (mod.) |
| Split peas 100 g cooked | 8g | 120 | 6.7g | 26.7% Gold | Complete (mod.) |
| Mung beans 100 g cooked | 7g | 105 | 6.7g | 26.7% Gold | Complete (mod.) |
| Green peas 100 g cooked | 5g | 80 | 6.3g | 25% Gold | Complete (mod.) |
| Pinto beans 100 g cooked | 9g | 145 | 6.2g | 24.8% Silver | Complete (mod.) |
| Adzuki beans 100 g cooked | 8g | 130 | 6.2g | 24.6% Silver | Complete (mod.) |
| Navy beans 100 g cooked | 8g | 140 | 5.7g | 22.9% Silver | Complete (mod.) |
| Chickpeas 100 g cooked | 9g | 165 | 5.5g | 21.8% Silver | Complete (mod.) |
How the tiers fall
3 of 18 reach Platinum (lupini beans, soybeans, edamame), 11 land Gold and 4 land Silver. Nothing here falls to Avoid — beans and legumes are a genuinely protein-dense food group. But the spread inside it is wide: 53.3% down to 21.8%, because pulses carry a substantial carbohydrate calorie load that varies by species. The tier thresholds are on the methodology page.
About the quality badge
Every row carries the same badge, and that is the finding rather than a rendering
bug: on amino-acid quality all 18 of these pulses classify alike — complete, moderate
DIAAS. None of the ranking above comes from protein quality; all of it comes from density.
Treat the badge as a label, never as a number. Our DIAAS coefficients are published for
isolate forms — commercial pea and soy protein isolate — and whole cooked pulses
score meaningfully lower than their isolates do, so we deliberately do not
rank these foods on a DIAAS-adjusted figure. See
complete protein, scored by DIAAS
for what those isolate numbers mean and where they apply.
Beans and legumes protein: common questions
Which beans have the most protein?
Per calorie, the highest-protein beans and legumes in USDA data are lupini beans (53.3%), soybeans (42.4%) and edamame (40%). At the top, lupini beans carry 16 g of protein in 120 calories per 100 g cooked. 3 pulses reach Platinum tier (40%+ of calories from protein): lupini beans, soybeans and edamame. Ranked by grams per cup instead, the order shifts because cup weights differ; per calorie it does not.
How much protein is in beans?
Cooked beans and legumes carry 5 to 18 g of protein per 100 g (about half a cup) in USDA SR-Legacy data, with lupini beans at the top and chickpeas at the bottom. Most common beans — black, pinto, kidney, navy — land close to 9 g per 100 g cooked.
Are beans a good source of protein?
Yes. 14 of the 18 beans and legumes here reach Gold tier or better, meaning at least 25% of their calories come from protein, and none fall to Avoid tier (under 15%). The trade-off is that every gram of pulse protein arrives with roughly two to three grams of carbohydrate, so hitting a high protein target on beans alone means a large calorie budget — the density column shows exactly how large for each one.
Are beans a complete protein?
Soybeans and edamame are complete. Other pulses are lower in the sulfur amino acids (methionine and cysteine) but not missing them, and the old rule that you must combine beans with grains at the same meal was retired decades ago — the body pools amino acids across the day. The practical constraint with plant protein is quantity and leucine dose, not completeness; see our DIAAS-scored guide to complete protein for the numbers. Complete protein, scored by DIAAS →
How much protein is in edamame?
Edamame has 12 g of protein and 120 calories per 100 g cooked — 40% of its calories come from protein (Platinum tier), or 10 g of protein per 100 calories. That ranks it #3 of 18 beans and legumes by Protein Density.
How much protein is in lentils?
Lentils has 9 g of protein and 115 calories per 100 g cooked — 31.3% of its calories come from protein (Gold tier), or 7.8 g of protein per 100 calories. That ranks it #4 of 18 beans and legumes by Protein Density.
How much protein is in black beans?
Black beans has 9 g of protein and 130 calories per 100 g cooked — 27.7% of its calories come from protein (Gold tier), or 6.9 g of protein per 100 calories. That ranks it #10 of 18 beans and legumes by Protein Density.
How much protein is in chickpeas?
Chickpeas has 9 g of protein and 165 calories per 100 g cooked — 21.8% of its calories come from protein (Silver tier), or 5.5 g of protein per 100 calories. That ranks it #18 of 18 beans and legumes by Protein Density.
Nutrition data from USDA FoodData Central (SR-Legacy), each record resolved by
ingest/verify-foods.mjs and carrying its own FDC id. Protein Density = protein
calories ÷ total calories, computed by lib/benchmark.ts. All servings are 100 g
cooked, without salt.